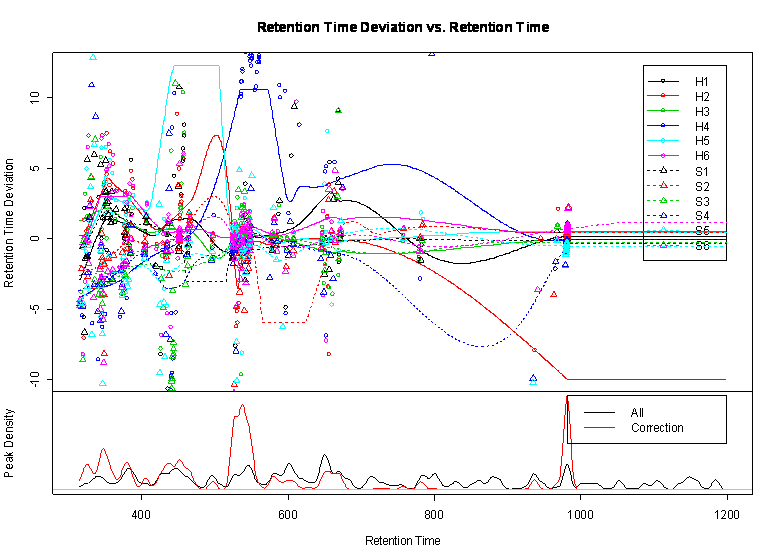
You may find an excellent description of the xcms alignment package here [PPT], however for people who have no experience with R (like me) and dislike the command line style (me too), here is a small helper script which can be used for all experiments. With a simple change of 4 lines the script runs then automatically without any further interaction needed. Parameters can be adjusted within the file. This is an R script. Copy and save it to example-macro-xcms-v1.R
### ***********************************************************************
### xcms v1.3.2
### URL: http://metlin.scripps.edu/download/
### LC/MS and GC/MS Data Analysis and Alignement from netCDF data
### Author: Colin A. Smith <This email address is being protected from spambots. You need JavaScript enabled to view it.>;
### ***********************************************************************
### ***********************************************************************
### The script assumes xcms is installed via Packages->Install->BioConducor
### Copy this file into commandline or open via "Open script"
### Set 4 variables in +++ section and run have fun
### Example Script: Tobias Kind fiehnlab.ucdavis.edu 2006
### ***********************************************************************
myAlign <- function () {
### +++++++++++++++++++++++++++++++++++++++++++++++++++++++++++++++
### These are the 4 variables you have to set for your own datafiles anything else runs automatically
### Set your working directory under Windows, where your netCDF files are stored
### Organize samples in subdirectories according to their class names WT/GM, Sick/Healthy etc.
### Important: use "/" not "\"
myDir = "C:/chemistry/xcms/example/faahKO/inst/cdf"
myClass1 = "KO"
myClass2 = "WT"
myResultDir = "myAlign"
### +++++++++++++++++++++++++++++++++++++++++++++++++++++++++++++++
### change working directory to your files, see +++ section
setwd(myDir)
### get working directory
(WD <- getwd())
### load the xcms package
library(xcms)
### you can get help typing the following command at the commandline
# ?retcor
### finds peaks in NetCDF
xset <- xcmsSet()
### print used files and memory usuage
xset
### Group peaks together across samples and show fancy graphics
### you can remove the sleep timer (silent run) or set it to 0.001
xset <- group(xset, sleep=.0001)
### calculate retention time deviations for every time
xset2 <- retcor(xset, family="s", plottype="m")
### Group peaks together across samples, set bandwitdh, change important m/z parameters here
### Syntax: group(object, bw = 30, minfrac = 0.5, minsamp= 1, mzwid = 0.25, max = 5, sleep = 0)
xset2 <- group(xset2, bw =10)
### identify peak groups and integrate samples
xset3 <- fillPeaks(xset2)
### print statistics
xset3
### create report and save the result in EXCEL file, print 20 important peaks as PNG
reporttab <- diffreport(xset3, myClass1, myClass2, myResultDir, 20, metlin = 0.15)
### print file names
# dir(path = ".", pattern = NULL, all.files = FALSE, full.names = FALSE, recursive = FALSE)
### output were done!
print("Finished, open by yourself the file myAlign.tsv and pictures in myAlign_eic")
}
### gives CPU, system, TOTAL time in seconds
system.time(myAlign())
### Currently R has no dual or multicore functionality, only a parallel library(snow)
### Benchmark on Dual Opteron 254 2.8 GHz with ARECA-1120 RAID5:
### 55 seconds total for the original 12 samples of the faahKO testset
### [1] 51.61 2.27 54.85 NA NA
### ***********************************************************************
### function finished
### ***********************************************************************