MGF mascot generic format files [MatrixSciences] are the standard format for MS/MS searches in proteomics and are now commonly used for small molecule MS/MS search. The minimum field definitions of an MGF file are the precursor mass, charge and m/z - abundance pairs. Multiple MS/MS product ion scans can be merged into a single file.
BEGIN IONS
PEPMASS=413.26611887841
CHARGE=1+
TITLE=MS/MS scan at 1.535 min with Intensity: 604.0
189.48956 1.9
283.62076 3.4
301.22977 66.3
311.08008 1.3
399.99106 2.3
END IONS
There are many flavours of MGF files with different headers and definitions. Except the minimum definition there are no globally accepted format rules, hence every MGF is different and software needs to be tested if its compatible with multiple formats. Be aware that many software tools do not export the charge state (negative mode) correctly.
MS vendor software MGF export
Most MS vendor software has an inbuilt MGF file export. Depending on the complexity they also allow different export settings such as abundance or peak or charge filters.
ABI Sciex Analyst - Use the Mascot Export Plugin, can be installed as additional option if not preconfigured.
Agilent - MassHunter QUAL, use MGF export and define charge state 1 to 2 and 100 most abundant peaks
Thermo - use extractMSn and MSFilereader plus dependency libraries
Bruker - use Compass MGF export or Skyline MGF export
Waters - MassLynx pkl or dta export and conversion to MGF or Mascot, Proteinlynx
Open Software export
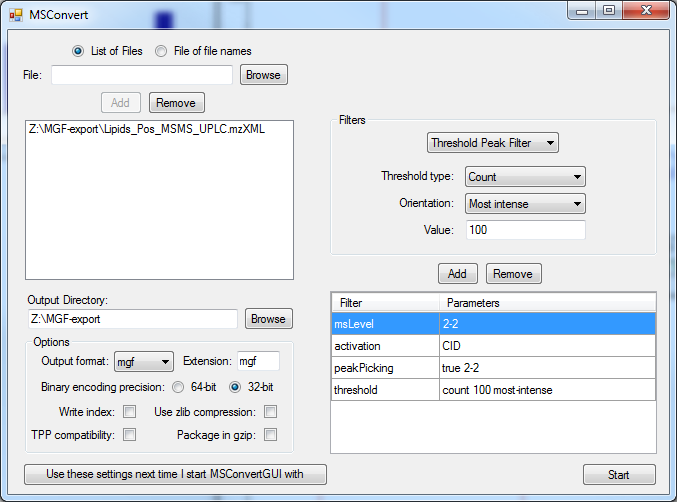
Proteowizard MSConvert GUI can convert most MS vendor formats including AB Sciex, Agilent , Bruker , Thermo and Waters using integrated file converters. There are 32-bit and 64-bit versions for Windows available, older MGF files must be closed and removed from the conversion folder to allow error free working. Also certain parameters are incompatible with each other or may lead to empty files. The ion count filter is used to reduce the filesize.
A small MS/MS MGF file with 2000 precursor ions can have a datasize of 20 Mbyte. A centroided and abundance filtered file (100 most intense MS/MS peaks) can be less than 1 Mbyte. The compression factor is 1:20 in such a case. Depending on the used software, here NIST MS Search (32 bit program), it is recommended to use smaller files, because of the 2GByte memory barrier and the expansion of few MByte to Gbyte in-memory. Using smaller file sizes also dramatically improves search speeds. Larger MS/MS files with 10,000 to 20,000 precursor ions can become quite large (hundreds of MByte). In order to improve search speed it is recommended to:
1) centroid the MS/MS spectra (create stick spectra) [peakpicking option]
2) limit the product ion number to the 100 most intense MS/MS peaks [Threshold Peak Filter]
3) Preserve metadata such as sample name, retention time and charge state and precursor abundance
4) Select activation mode such as CID or HCD [activation]
5) Only export MS2 levels for MS/MS search [msLevel 2-2]
Impact of centroiding and peak filters on library search scores
The search scores for centroided vs non-centroided data plus the ion count filter heavily influence the search scores. Unfortunately the scores widely vary. As an example a compound with m/z 758.571 Da [M+H]+ obtained under 25V collision energy was compared under different centroiding and peak filtering algorithm against a database of 14 matching reference spectra of the same compound obtained under different CID voltages (1-Hexadecanoyl-2-octadecadienoyl-sn-glycero-3-phosphocholine). CID voltage range 2V-35V.
| Num | Method | Score | Dot Product | Reverse-Dot Product | Hit |
|---|---|---|---|---|---|
| 1 | profile data MS/MS |
354 231 |
858 854 |
891 906 |
30V CID reference 35V CID reference |
| 2 | profile data (100 most intense peaks) |
307 208 |
836 848 |
858 868 |
20V CID reference 25V CID reference |
| 3 | centroided data (stick data) |
181 157 |
754 825 |
802 877 |
12V CID reference 30V CID reference |
| 4 | centroided (100 most intense) (25 total) |
131 110 |
826 804 |
858 837 |
23V CID reference 25V CID reference |
| 5 | centroided (200 most intense (50 peaks) |
207 161 |
759 825 |
797 870 |
12V CID reference 23V CID reference |
My verdict here is not supported by the data above, but I would leave the centroiding algorithm to the vendor (in the hope they are specialists and know what they are doing) and only acquire centroided (stick) MS/MS data and not profile MS/MS data. Then use the peak filter and only export the 100 most intense MS/MS product ion peaks into the MGF file.
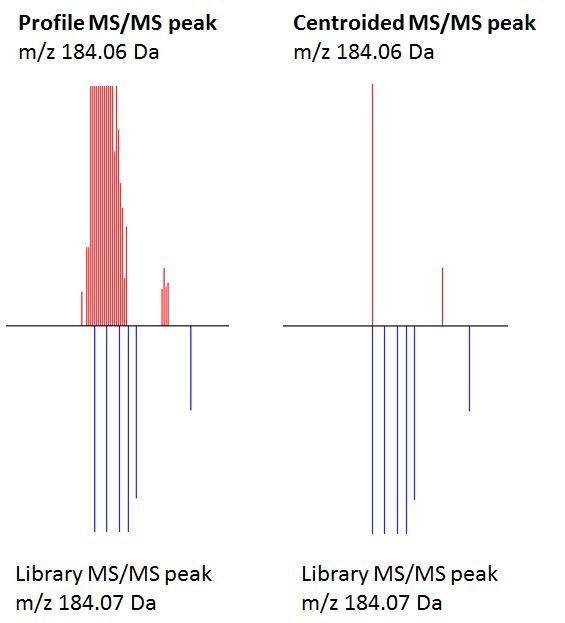
The figure explains the different hit scores. The left experimental profile MS/MS peak has around 30 product ion peaks that can potentially match multiple library reference spectral peaks. The lower bottom reference spectrum has 4 high-resolution MS/MS peaks (184.07 Da, 131.97 Da, 184.13 Da, 184.15 Da). Because the search algorithm considers and sums all matching four m/z values and their abundances, the hit scores are slightly higher for the profile match. The right-hand side figure shows the centroided MS/MS product ion peak and this one only hits one single high-resolution reference library spectrum peak, hence all scores are lower.
Additionally, because the library also contains different CID voltage spectra from the same compound, the scoring algorithm will pick different voltages as the best score. The experimental spectrum was obtained under 25V CID. Just centroiding without peak filtering results in the (wrong) 12V spectrum as best match. If the reverse-dot product score is used for matching (which ignores non-matching peaks in the target spectrum) the centroided and 100 most intense selection gives a rev-score of 858, similar to the profile mode and 100 most-intense. But the file size for the profile mode MGF file is much larger (20x). Plus the centroiding step removes many of the noisier peaks and makes the visual inspection easier.
How centroiding and peak filtering of product ions in the MS/MS spectrum globally influences search scores has to be determined on large and diverse spectral collections. The current solution gives a recommendation from a practical stand-point but is not totally supported by the presented data here. The selection of different CID voltages 10V, 20V, 30V, 40V, 60V for lipid profiling experiments is another useful recommendation, because it increases the chance that an experimental spectrum hits diverse library spectra.
LINKS and downloads